NZHistory.net / Gallery /
Immigration to New Zealand
Who were the immigrants?

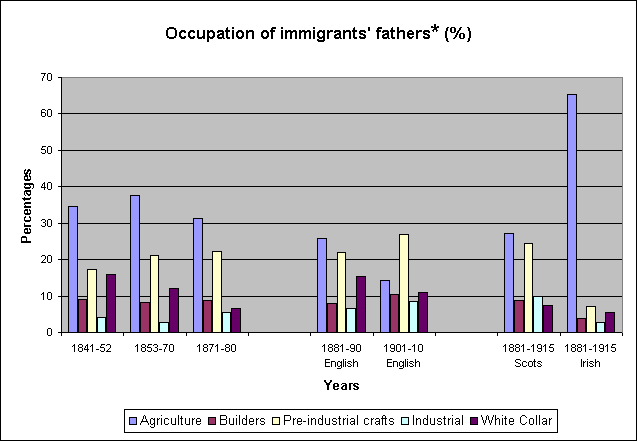
Occupation of immigrants' fathers* (%)
| Date |
Agriculture |
Builders |
Pre-industrial crafts |
Industrial |
White Collar |
| 1841–52 |
34.6 |
9.1 |
17.4 |
4.2 |
15.9 |
| 1853–70 |
37.6 |
8.3 |
21.2 |
2.7 |
12.2 |
| 1871–80 |
31.2 |
8.9 |
22.1 |
5.4 |
6.5 |
| |
|
|
|
|
|
| 1881–90 English |
25.9 |
7.9 |
21.9 |
6.6 |
15.5 |
| 1901–10 English |
14.4 |
10.4 |
27 |
8.6 |
11.1 |
| |
|
|
|
|
|
| 1881–1915 Scots |
27.2 |
8.9 |
24.5 |
9.8 |
7.4 |
| 1881–1915 Irish |
65.2 |
3.9 |
7.2 |
2.8 |
5.5 |
*These figures are taken from the death certificates of British and
Irish immigrants to New Zealand (which include information on the
father's occupation). In other words, they indicate the family
background of a migrant, but not necessarily their own occupation. The
dates refer to the year the person migrated to New Zealand.
The figures and graph suggest:
-
The very great importance of immigrants with an agricultural
background.
-
The large number of immigrants whose background was either in
building or in pre-industrial crafts such as blacksmiths,
wheel-wrights, coopers or flax-workers. Those with an agricultural
or craft background were often from the same communities where
people would mix some farming with traditional crafts. Good
examples are the immigrants from Ulster, who combined working the
land with flax-weaving and spinning; or those from Shetland who had
small crofts, but also spent some of the year fishing.
-
The low numbers of immigrants from an industrial background who
remained below 10% throughout the 19th century.
- The significant number of migrants in the 1840s from a white collar background.
-
The Irish were even more disproportionately of a farming background
than those from Scotland and England.
Home | Next Page:
So what?:
some conclusions
Back to top

